Overview#
This setup connects HashiCorp Vault telemetry with Prometheus for secure metrics collection in a Kubernetes environment. It uses Argo CD, cert-manager, and the Vault CSI driver to manage authentication and TLS through a GitOps workflow.
1. Enable Vault Telemetry for Prometheus#
Vault supports telemetry export compatible with Prometheus.
Telemetry exposure is configured through the Vault Helm chart’s serverTelemetry section.
serverTelemetry:
  serviceMonitor:
    enabled: true
    interval: 30s
    scrapeTimeout: 10s
    tlsConfig:
      insecureSkipVerify: false   # Vault uses self-signed certs
      serverName: vault.vault.svc
      ca:
        secret:
          name: vault-metrics-client
          key: ca.crt
    authorization:
      credentials:
        name: prometheus-token   # name of the Secret synced by CSI
        key: token               # key inside the Secret
    selectors:
      release: prometheus
This configuration allows Prometheus to authenticate using a token stored in a Kubernetes Secret (prometheus-token) to access Vault’s /sys/metrics endpoint via HTTPS.
After applying these values, a new serviceMonitor resource is created automatically in the vault namespace.

To make the setup work, the serverTelemetry.serviceMonitor.authorization and tlsConfig
fields must be properly configured. This configuration is handled in the next section.
2. Authorization configuration#
2.1 Vault Policy for Metrics#
A dedicated Vault policy was defined to allow read access to the /sys/metrics endpoint.
vault policy write prometheus-metrics - <<EOF
path "/sys/metrics" {
  capabilities = ["read"]
}
EOF
2.2 Token Generation#
A token was generated under this policy.
vault token create -policy=prometheus-metrics -field=token
The generated token is stored in Vault’s KV secrets engine for retrieval through the CSI integration.
2.3 Storing Token in Vault#
The token is stored under the path kv/prometheus:
vault kv put kv/prometheus token="hvs.secret-token..."
2.4 Reader Policy#
A separate policy was introduced to permit read access to the token location.
vault policy write prometheus-token-reader - <<EOF
path "kv/data/prometheus" {
  capabilities = ["read"]
}
EOF
2.5 Kubernetes Role#
A Kubernetes authentication role named prometheus was then registered in Vault.
The role is bound to the service account sa-vault in the vault namespace, matching the namespace
where the ServiceMonitor was created.
vault write auth/kubernetes/role/prometheus \
  bound_service_account_names=sa-vault \
  bound_service_account_namespaces=vault \
  policies=prometheus-token-reader \
  ttl=24h
2.6 Secret Synchronization#
The Vault CSI driver was used to fetch the Prometheus token and make it available as a Kubernetes Secret.
This behavior was defined in a dedicated SecretProviderClass resource.
apiVersion: secrets-store.csi.x-k8s.io/v1
kind: SecretProviderClass
metadata:
  name: vault-prometheus-token
  namespace: monitoring

spec:
  provider: vault

  parameters:
    vaultAddress: "https://vault.vault.svc:8200"
    vaultMountPath: "kubernetes"
    roleName: "prometheus"
    vaultTLSCaCert: "/vault/userconfig/ca/ca.crt"
    objects: |
      - objectName: "token"
        secretPath: "kv/data/prometheus"
        secretKey: "token"

  secretObjects:
    - secretName: prometheus-token
      type: Opaque
      data:
        - objectName: "token"
          key: token
A lightweight job was used to trigger the Vault CSI provider and ensure that the Prometheus token was synchronized as a Kubernetes Secret.
apiVersion: batch/v1
kind: Job
metadata:
  name: sync-prometheus-token
  namespace: vault
  labels:
    app.kubernetes.io/name: prometheus
    app.kubernetes.io/component: vault-sync

spec:
  backoffLimit: 1

  template:
    spec:
      serviceAccountName: sa-vault
      restartPolicy: OnFailure

      containers:
        - name: sync-prometheus-token
          image: busybox
          imagePullPolicy: IfNotPresent
          command: ["/bin/sh", "-c"]
          args:
            - |
              echo "Syncing Prometheus Vault token..."
              sleep 10
              echo "Sync complete."

          volumeMounts:
            - name: secrets-store
              mountPath: /mnt/secrets-store
              readOnly: true

      volumes:
        - name: secrets-store
          csi:
            driver: secrets-store.csi.k8s.io
            readOnly: true
            volumeAttributes:
              secretProviderClass: "vault-prometheus-token"
3. TLS Configuration#
The telemetry endpoint is exposed over HTTPS by Vault, which uses an internal self-signed
certificate issued by the cluster’s Vault CA (vault-root-ca). Prometheus must verify this
certificate before scraping metrics.
In this setup, TLS validation remains fully enforced (insecureSkipVerify: false).
Prometheus is configured to trust the Vault CA and to validate the Vault server certificate
against a known DNS name rather than the pod IP.
tlsConfig:
  insecureSkipVerify: false
  serverName: vault.vault.svc
  ca:
    secret:
      name: vault-root-ca
      key: ca.crt
The field serverName is required because Vault’s server certificate includes DNS entries such as
vault.vault.svc and vault.vault.svc.cluster.local, but does not include pod IPs (10.42.x.x), which
are the actual addresses Prometheus uses for scraping. Without this field, hostname validation would fail.
This configuration ensures:
- The connection remains encrypted and validated end-to-end.
- Prometheus trusts only certificates signed by the internal Vault CA.
- No certificate verification is skipped or weakened.
Results#
Prometheus successfully detected the Vault telemetry endpoint through the generated ServiceMonitor.
The Status > Target health appeared as UP and exposed the /sys/metrics endpoint over HTTPS,
confirming that the authorization token provided by Vault was valid.

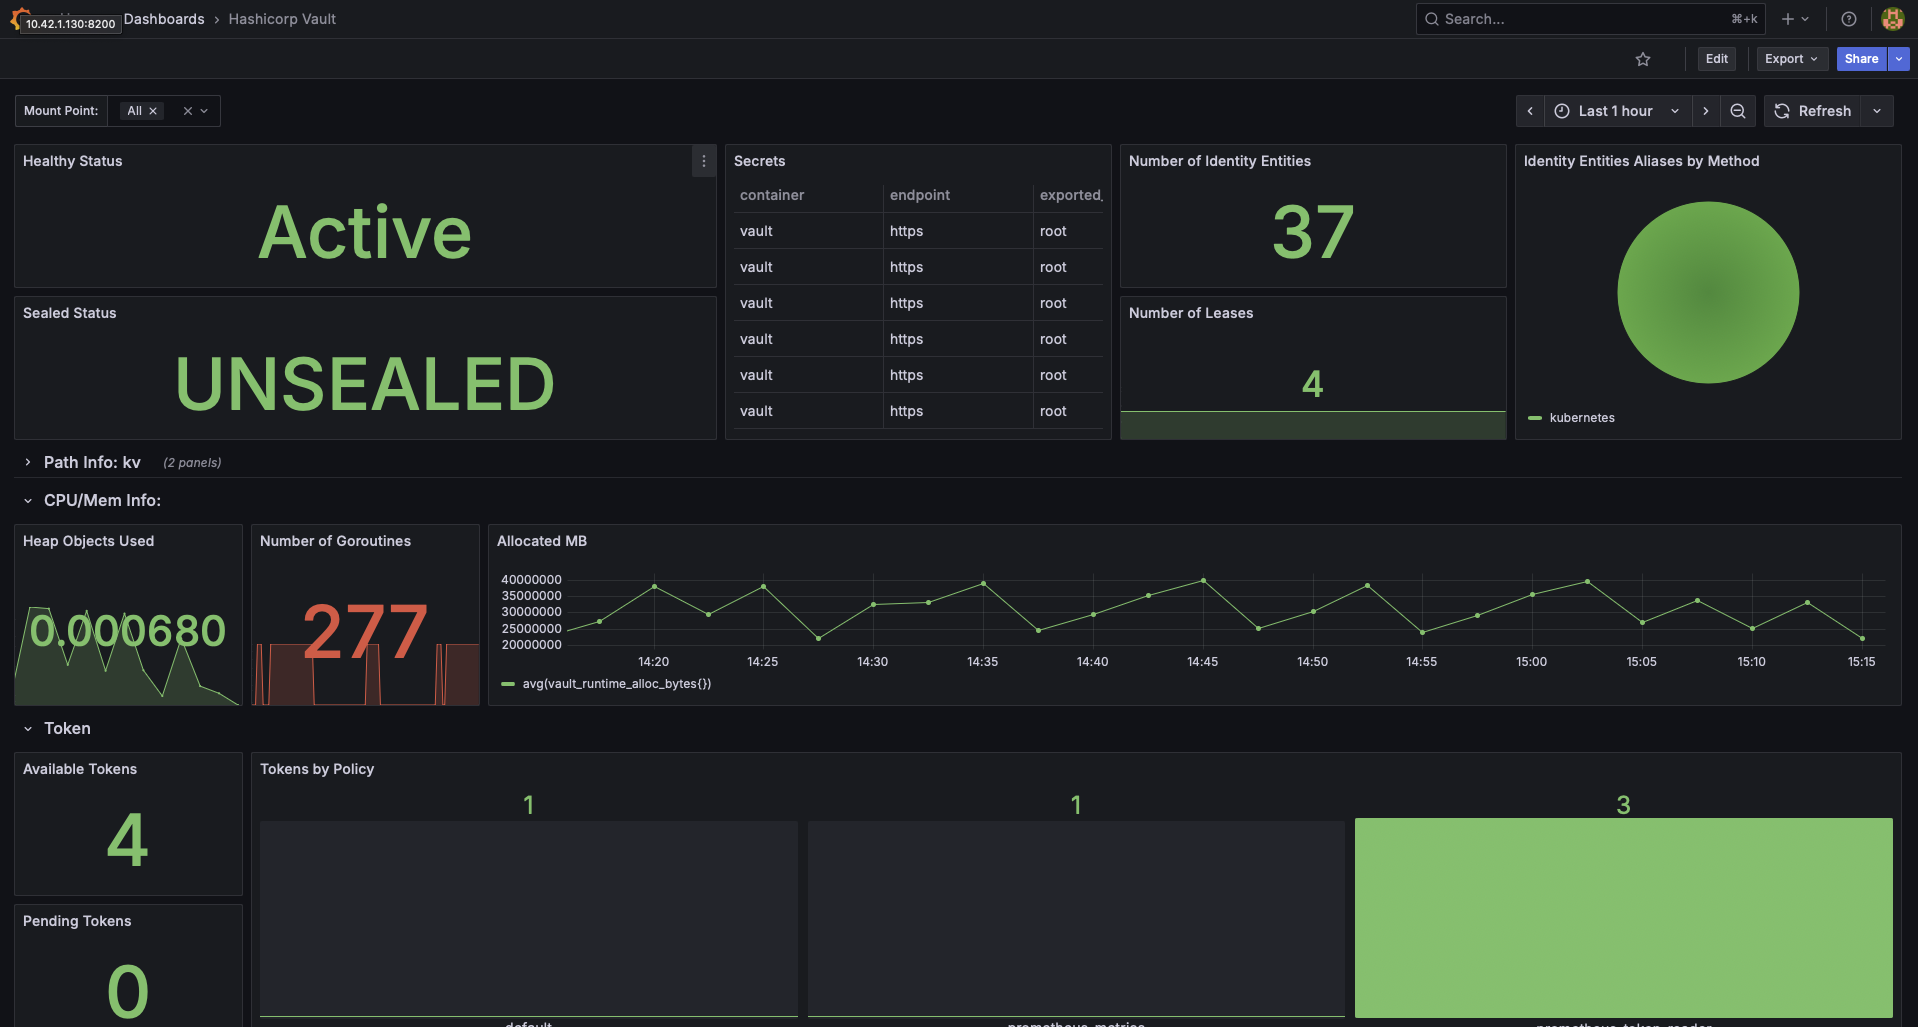
Metrics were visualized in Grafana using the HashiCorp Vault dashboard.
The instance was shown as Active and Unsealed, with data collected on various data.


Key Takeaways#
- Vault telemetry can be securely exposed to Prometheus using a GitOps workflow.
- Authentication and token rotation are handled through Vault policies and CSI integration.
- TLS verification remains enforced; no insecure skipping is required.
- Using
serverNameensures compatibility when Vault Pod IPs are not part of the certificate SAN. - The approach provides observability for Vault without exposing metrics publicly or weakening security.
Repository & Implementation#
All Kubernetes manifests and configuration files are maintained declaratively under Git control.
Vault access policies, KV secrets, authentication roles, and tokens were created manually during setup.
Implementation available under the GitOps repository:
whitehatcats/k3s-homelab-gitops
